

A free, powerful, multi-purpose tool that helps you monitor system resources, debug software and detect malware.
Graphs and statistics allow you quickly to track down resource hogs and runaway processes.
Use Ctrl+I to view system performance information. Move your cursor over a graph to get a tooltip with information about the data point under your cursor. You can double-click the graph to see information about the process at that data point, even if the process is no longer running.
Can’t edit or delete a file? Discover which processes are using that file.
Use Ctrl+F to search for a handle or DLL. If all else fails, you can right-click an entry and close the handle associated with the file. However, this should only be used as a last resort and can lead to data loss and corruption.
Use Ctrl+I to view system performance information. Move your cursor over a graph to get a tooltip with information about the data point under your cursor. You can double-click the graph to see information about the process at that data point, even if the process is no longer running.
Add extra columns to show even more system activity and information!
Get real-time information on disk access.
This may look very similar to the Disk Activity feature in Resource Monitor, but System Informer has a few more features!
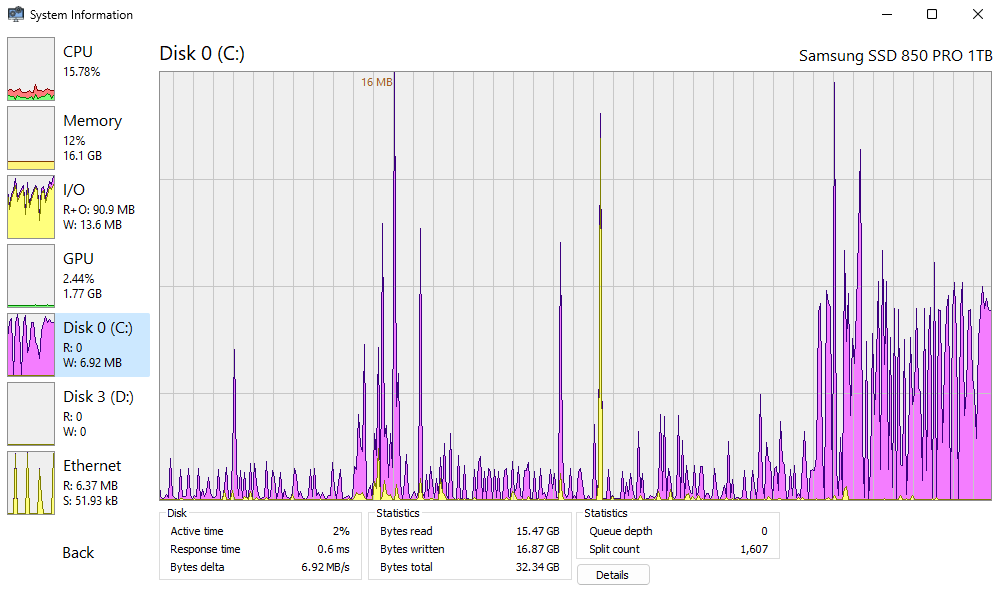
Get real-time information on disk usage.
Enable disk statistics for detailed disk usage information.
View detailed stack traces with kernel-mode, WOW64 and .NET support.
Hover your cursor over the first column (with the numbers) to view parameter and line number information when available.
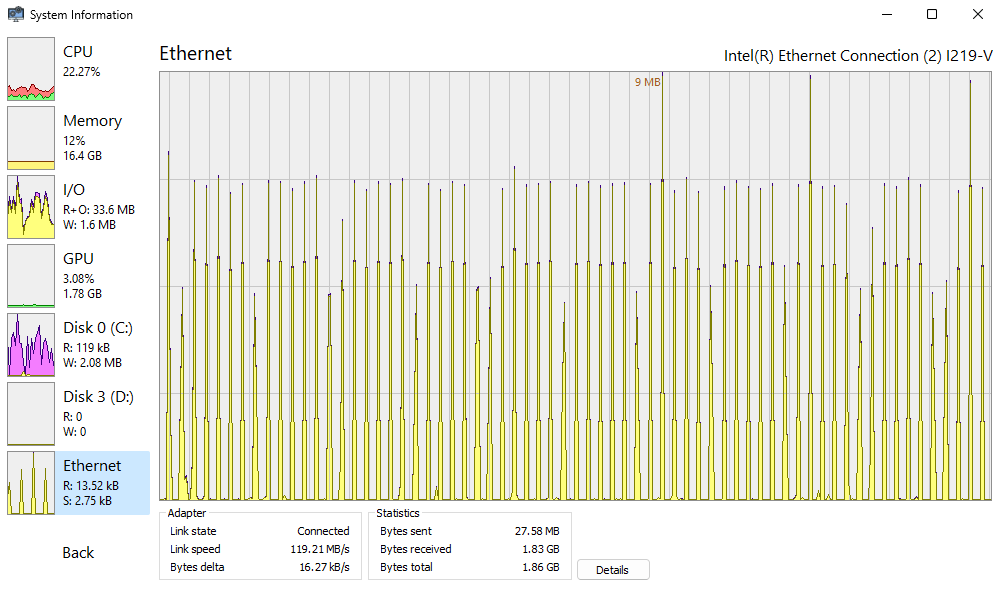
Get real-time information on network usage.
Enable network adapter statistics for detailed information network usage information.
Go beyond services.msc: create, edit and control services.
By default, System Informer shows entries for drivers in addition to normal user-mode services. You can turn this off by checking View > Hide Driver Services.
Get real-time information on gpu usage.
By default, System Informer shows gpu usage for all processes. Hover your cursor over the graph for detailed information when available.
Theme support to match your style.
System Informer supports light and dark themes and has options for modern icons.

One thought on “System Informer 3.2.25011”
nic nie ma